

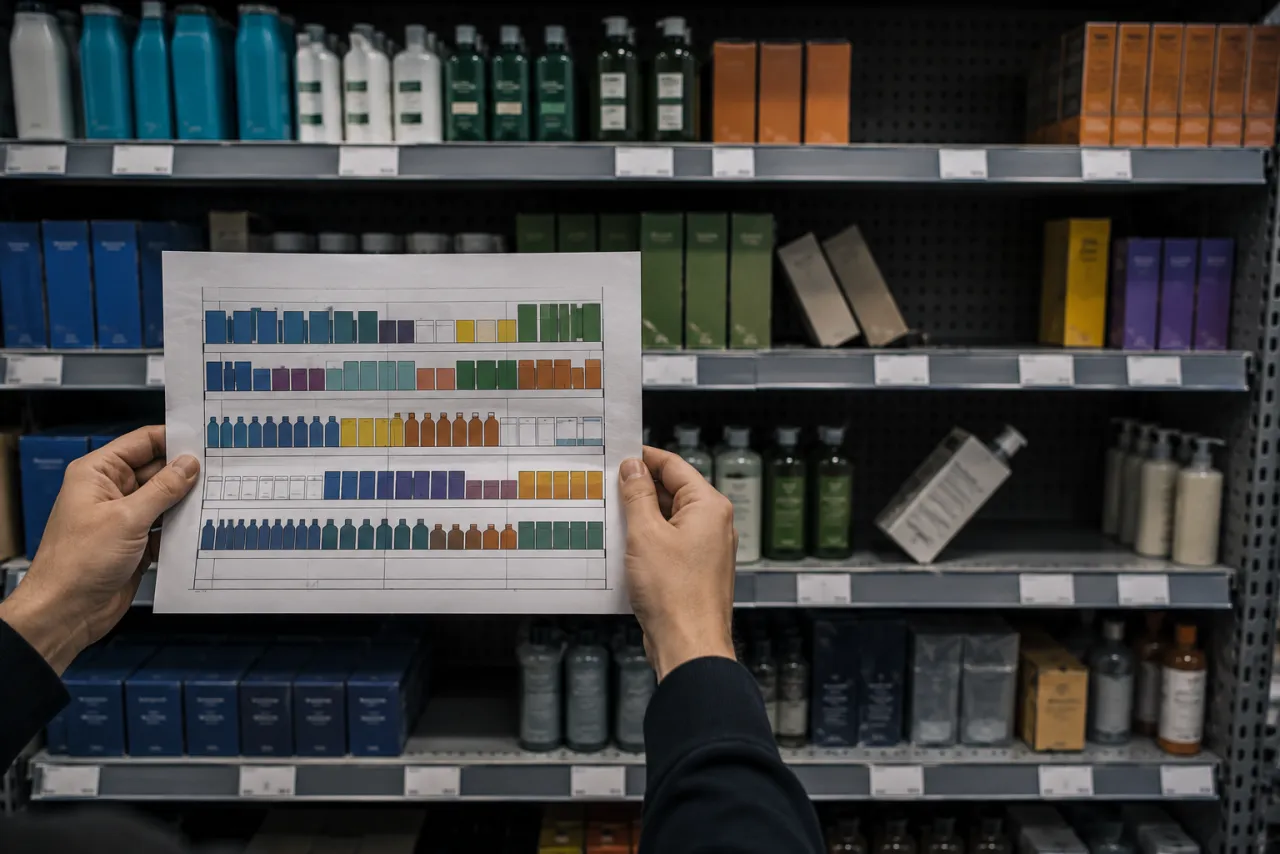
Reset day was three weeks ago. The dashboard says the new planogram landed in nearly every store, because nearly every manager tapped “complete” and attached a photo of their best-looking bay. Then a regional walks one store, finds half the section still flowing the old way, and realizes the photo showed the only four feet that matched.
Planogram compliance is the most self-reported number in retail operations, and self-reported numbers drift toward whatever keeps people out of trouble. Getting the real number does not require counting every shelf in every store. It requires a written definition of “compliant”, a sampling method you can repeat, and the discipline to separate store problems from headquarters problems.
Why Self-Reported Planogram Compliance Inflates
Nobody is exactly lying. The manager confirming a reset is grading their own homework, under deadline, with a phone camera and a strong incentive to be finished. The photo shows the bay that matches the plan. The checkbox gets tapped at the end of a double shift. And the number is captured once, during reset week, then never again while the section drifts a little every day: a discontinued item’s facings quietly absorbed by a neighbor, a new item parked wherever it fit, tags never swapped.
So the gap between dashboard and shelf widens with every cycle, and it widens fastest in the stores with the least labor, which means the number is most wrong exactly where execution is weakest. Operators who put anonymous eyes on their shelves for the first time are routinely surprised by the size of that gap.
Define Tolerance Before You Count Anything
“Compliant” needs a definition tight enough that two auditors standing in the same spot reach the same score. Write it down before anyone counts a facing. A workable starting tolerance for most categories:
- Right item, right section, planned shelf: mandatory, no tolerance
- Facings within one of plan: a four-facing item showing three still passes
- Shelf tag present and matching the item above it: mandatory
- New and promoted items placed exactly to plan: no tolerance during the launch window
The specific lines you draw matter less than drawing them once, in writing. A strict count against a loose definition is theater, and a loose count against no definition is what most chains are running today.
Sample Sections, Not the Whole Store
A full-store planogram count takes hours, so it happens rarely and gets rushed when it happens. Sampling beats it on every axis that matters. Pick a fixed panel of six to ten sections: your highest-velocity categories, the sections tied to current promotions, and one or two rotating wildcards so stores cannot groom the panel. Audit the same panel in every store, score each section as the percent of items within tolerance, and photograph every failure.
Now you hold numbers that compare across stores and across quarters, which is the entire point. This is how merchandising gets scored inside a Retail Integrity Audit: fixed sections, photo evidence, a written tolerance. An hour of honest sampling beats a day of rushed counting every time.
Set the cadence when you set the panel. Quarterly is enough for most categories, monthly for promo-heavy formats, and always within a month of a major reset. Keep the panel and the tolerance frozen between rounds, for the same reason you version any audit instrument: change the ruler and the trend line dies.
Store Problem or System Problem?
Measurement only earns its cost when it changes the fix, and the right fix depends on the pattern across stores, not the result in any one of them.
When one store fails sections its sister stores pass, that is a store-level fix: training, reset-week labor, a manager who treats the planogram as a suggestion. Coach it, then re-check the same panel within a month.
When the same section fails everywhere, stop coaching. The planogram was drawn for a fixture the fleet does not have. The tag packs land three days after the reset date. The new item never shipped. Those failures were created at headquarters and can only be fixed there, and pushing them down onto store managers just teaches the field to fake the photo. This split is the biggest reason to read multi-location audit data in aggregate instead of store by store.
If You Are the Brand, Verify Independently
CPG teams pay for shelf position, displays, and resets they almost never see with their own eyes, and retailer-reported execution inflates for all the same reasons store self-audits do, with an extra layer of distance added. Independent shelf checks, item by item against your agreement and backed by photos, are how brands learn what actually happened on the shelf they paid for. That is the core of our CPG retail verification work.
Get Ground Truth on Ten Stores
All of this depends on one thing: a measurement nobody inside the reporting chain can lean on. Anonymous auditors with cameras, a written tolerance, and no stake in the score have exactly one job, which is describing the shelf as it stands.
The fastest way to see your real number is the 10-store pilot: $7,500 all-in for a custom checklist built around your planograms and tolerances, ten anonymous photo-backed visits, severity-scored reports, and a one-hour executive debrief that sorts the store fixes from the headquarters fixes. Send us a note and bring the planogram you trust the least.