

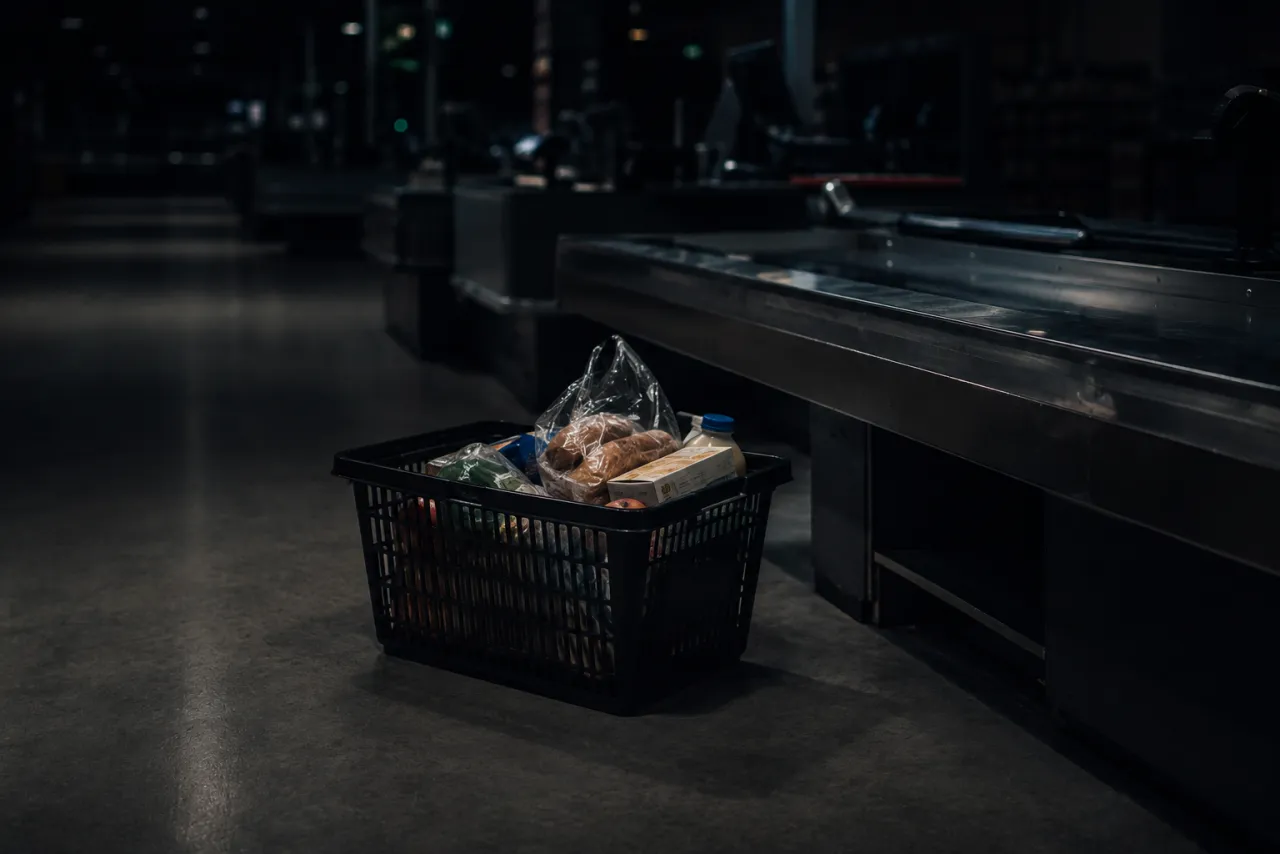
Stand at the front of one of your stores on a Saturday afternoon. Two of six lanes are open, the line is nine deep, and a woman near the back sets her basket on the candy rack and walks out. Nothing rings. No alert fires. As far as your systems know, that trip never existed.
That is the shape of the cost of poor retail execution. It almost never arrives as one visible number. It leaks through dozens of small failures that each look too minor to escalate, and it compounds while every dashboard reports a normal week.
You do not need an industry statistic to size it, and you should be suspicious of anyone who hands you one. You need a pencil, your store count, and honest assumptions. Every number below is deliberately hypothetical. Swap in your own and see what the leak looks like in your chain.
Where the Cost of Poor Retail Execution Hides
The money does not leave through the safe. It leaves through five doors, and most reporting watches none of them.
- Abandoned trips. Checkout friction, missing help, out-of-stocks that end a visit early.
- Wasted promo spend. Displays and allowances you funded that never made it to the floor.
- Markdown pressure. Late sets that shorten the full-price selling window.
- Safety exposure. The blocked exit or wet floor that costs nothing until it costs everything.
- Brand erosion. Customers who quietly reroute to a competitor and never file a complaint.
Door One: The Trips You Never See
Start with checkout. Suppose one store loses just three trips a day: one to a long line, one to a payment terminal that will not take tap, one to a shopper who could not find anyone to unlock a case. Suppose your average basket is $40. That is $120 a day, roughly $43,800 a year, from a single store. Across 25 stores, the same modest assumption clears a million dollars. Think three trips is too aggressive? Cut it to one trip a day and the 25-store figure still lands around $365,000.
None of this appears in shrink, because the point of sale only records purchases that happened. The lost trip is invisible unless someone stands in the store and watches it happen, which is precisely what a Checkout Experience Audit exists to do.
Door Two: The Display You Paid For
Now the promo budget. Suppose you fund an end cap program at $600 per store across 40 stores: fixtures, freight, signage, and allowance. That is $24,000 committed before a single unit sells. Suppose four stores never build the display and six build it a week into a two-week promotion. A quarter of your placements either never existed or ran at half strength, which means a quarter of that spend bought nothing.
Here is the uncomfortable part: your compliance report will likely say 100 percent, because the question was self-answered, yes or no, by the store being measured. The display that never went up gets marked complete more often than anyone likes to admit.
Door Three: Late Sets and the Markdown Cascade
Seasonal and promotional goods earn full margin only inside their window. Suppose a set is planned for a 60-day season and one store lands it 12 days late. A fifth of the selling window is gone, and the inventory that would have sold at full price is still on hand when clearance begins. Suppose that pushes $3,000 of goods per store into a 30 percent markdown: $900 lost, per store, per season. Multiply by your seasons per year and your store count. The per-store number looks forgivable. The network number does not.
The Slow Leaks: Safety and the Brand
Two doors resist neat math, and they are the widest ones.
Safety exposure does not average. A propped fire exit, a spill without a cone, a ladder left standing in an aisle: these cost nothing on most days, and then one incident outweighs years of quiet savings. You cannot model it with a daily figure. You can only decide how long you are comfortable not knowing whether those conditions exist.
Brand erosion is slower still. The customer who meets a dirty restroom or the expired end cap in aisle 4 rarely complains. She simply reroutes next week, and you never see the moment she decided. By the time erosion shows up in comp sales, it has been running for quarters.
Put Your Own Number on It
Your dashboards will not run this math for you. They record what happened at the register, not what almost happened at the door. If you want the leading indicators worth tracking instead, we broke those down in our guide to retail execution KPIs. And when you weigh the leak against the price of actually looking, the comparison is not close: we walk through the spend side in what a retail store audit costs.
The fix is not another self-reported checklist. It is independent eyes in the store, with every finding tied to a photo, a timestamped note, or a receipt, the way our process is laid out in how reporting works. Observation first, blame never, evidence always.
If you would rather replace assumptions with ground truth, start small. Our 10-store pilot is $7,500 all-in: ten anonymous visits, photo-backed and severity-scored reports, an aggregated findings summary, and a one-hour executive debrief, delivered in three to five weeks with no long-term commitment. Run the thought experiment with your numbers first. Then contact us and find out which of those five doors is standing open in your stores.